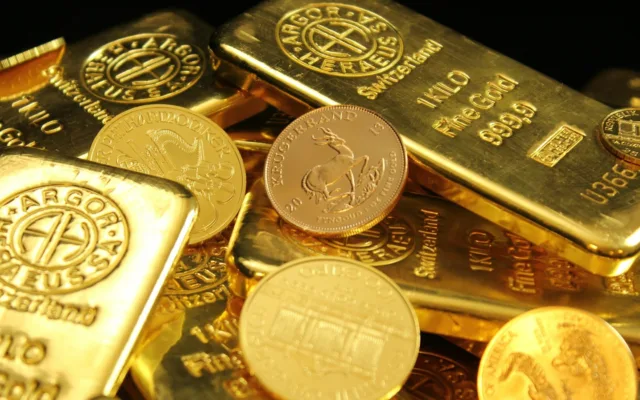
Gold and silver often move in the same general direction, but their prices do not always rise or fall by the same percentage. Gold is widely viewed as a monetary and reserve asset, while silver also has substantial industrial uses. Their different demand patterns can create periods when one metal outperforms the other.
The gold-silver ratio offers a simple way to compare their relative prices. It cannot tell investors exactly when to buy or sell, but it can provide useful context when combined with market fundamentals, costs and risk management.
What Is the Gold-Silver Ratio?
The gold-silver ratio measures how many troy ounces of silver have the same quoted market value as one troy ounce of gold.
The formula is:
Gold-silver ratio = Gold price per troy ounce ÷ Silver price per troy ounce
Suppose gold trades at $3,000 per ounce and silver at $50 per ounce. The ratio is:
$3,000 ÷ $50 = 60
In this hypothetical example, one ounce of gold costs as much as 60 ounces of silver. The prices are illustrative, not current market quotations.
A ratio of 60 does not automatically mean silver is cheap. It only describes the relative prices at that moment.
How the Ratio Changes
Consider three hypothetical market situations.
| Scenario |
Gold price |
Silver price |
Ratio |
| Starting point |
$3,000 |
$50 |
60 |
| Silver outperforms |
$3,000 |
$60 |
50 |
| Gold outperforms |
$3,300 |
$50 |
66 |
In the second scenario, silver rises 20% while gold remains unchanged. The ratio falls from 60 to 50.
In the third scenario, gold rises 10% while silver remains unchanged. The ratio increases from 60 to 66.
These calculations show why the ratio is a relative measure, not a direct measure of profit. It can fall because silver rises faster, gold falls faster, or both metals move in different directions.
Does a High Ratio Mean Silver Is Undervalued?
Not necessarily.
A high ratio means gold is expensive relative to silver compared with a lower ratio. Some investors interpret this as a reason to investigate silver more closely, but a valuation conclusion requires additional evidence.
Silver has industrial exposure that gold does not share to the same extent. A slowdown in manufacturing may weaken silver demand even when gold benefits from investor interest in uncertainty.
Likewise, a low ratio does not guarantee that gold will outperform. Silver may remain strong if industrial consumption and investment demand support its price.
The Silver Institute reported that the ratio fell below 50 in January 2026 after silver reached record levels. That was a historical market observation at the time, not proof that either metal was correctly or incorrectly valued. Ratios change as market conditions change.
A Better Way to Use the Ratio: Compare Actual Outcomes
Suppose an investor is considering two hypothetical allocations of $10,000:
- Option A: invest the full amount in gold.
- Option B: invest the full amount in silver.
Assume gold subsequently rises 8%, while silver rises 15%. Ignore fees, taxes, exchange-rate movements and any difference in transaction costs.
| Investment |
Starting amount |
Assumed return |
Ending value |
| Gold |
$10,000 |
8% |
$10,800 |
| Silver |
$10,000 |
15% |
$11,500 |
Silver finishes $700 ahead in this scenario. But the ratio alone did not produce that outcome; the assumed price changes did.
Now reverse the assumptions. If gold rises 10% and silver falls 12%, the gold investment ends at $11,000, while the silver investment ends at $8,800. The difference becomes $2,200 in gold’s favour.
These are mathematical illustrations, not forecasts. They demonstrate why an investor should examine possible losses as carefully as potential gains.
What Should Be Checked Alongside the Ratio?
Before making a decision, review:
- Interest rates and currency movements: Changes in real yields and the US dollar can influence gold and silver differently.
- Industrial activity: Silver demand can respond to electronics, automotive manufacturing, solar technology and broader economic conditions.
- Supply and inventories: Mine output, recycling and available above-ground stocks help shape physical-market conditions.
- Ownership costs: Dealer premiums, buy-sell spreads, storage, fund fees and taxes can affect realised returns.
- Portfolio risk: Silver’s industrial exposure and price volatility may make it unsuitable for investors who need stable short-term capital.
Investors in the United States, Canada, the United Kingdom and Australia should also calculate returns in their own currency. A US-dollar ratio can provide a global reference, but exchange-rate changes affect local-currency performance.
Conclusion
The gold-silver ratio is a useful starting point for comparing two different precious metals. It identifies relative price changes and helps investors ask better questions about valuation.
It does not, by itself, prove that either metal is cheap or expensive. Stronger analysis combines the ratio with industrial demand, interest rates, supply conditions, transaction costs and the investor’s own risk tolerance.
The goal is not to predict every market turn. It is to understand what the numbers show, what they leave out, and which assumptions would need to hold for an investment decision to succeed.
Disclaimer: This article is for general educational purposes only and is not personalised financial or investment advice. Precious metals can lose value, and past price relationships do not guarantee future performance.
Sources